Choosing the right Ptp Machines requires more than comparing speed, price, or stainless-steel appearance. Global buyers must examine production realities: tablet dimensions, blister formats, forming depth, sealing materials, and expected batch volumes. A machine that performs well in one facility may struggle with another site’s power supply, humidity, operator training, or maintenance capacity.
“Reliable packaging begins with a process designed around the product, not around the machine,” says Dr. Markus Keller, a pharmaceutical packaging engineering consultant. His point is practical. Buyers should request factory acceptance data, sample blister runs, changeover times, and documented validation support before signing a purchase agreement. Ask difficult questions early.
Can the Ptp Machines handle frequent product changes without excessive waste? Are critical spare parts available near the installation country? Does the supplier provide remote diagnostics, operator training, and responsive technical service? These details often matter more than a brochure’s maximum output.
A clear evaluation should also include total ownership cost. Energy use, tooling replacement, rejected packs, preventive maintenance, and software updates can quietly reshape the original budget. Regional support matters, too. A machine may be technically excellent, yet inconvenient when every service visit requires international travel.
There is no perfect specification sheet. Buyers sometimes overestimate speed and underestimate flexibility. That mistake is expensive. The strongest decision combines factory evidence, lifecycle planning, supplier credibility, and realistic operating conditions. This guide explains how global purchasers can compare Ptp Machines with greater confidence, while recognizing that careful questions remain part of the process.
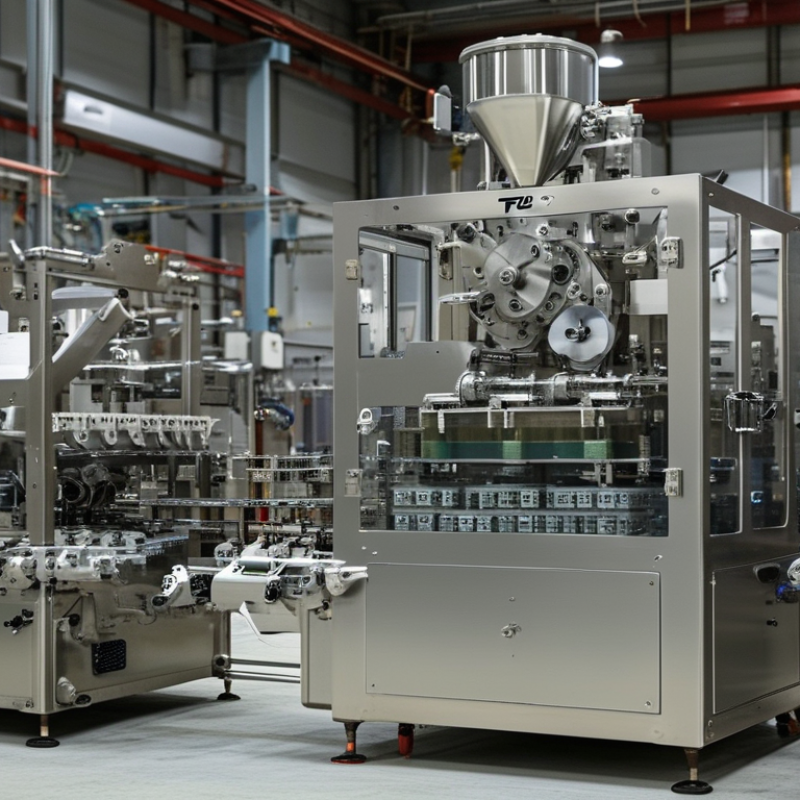
A PTP machine rated at 50–600 blisters per minute offers broad production flexibility. However, speed alone cannot define performance. A 600-blister rating may apply only to a simple, shallow cavity format. Larger tablets, cold-form aluminum, or complex feeding can reduce actual output. According to PMMI’s 2023 Pharmaceutical Packaging Trends report, manufacturers increasingly value flexible equipment for smaller batches and changing product portfolios. That makes format range important.
Map each product against blister length, width, depth, pitch, sealing temperature, and cutting pattern. Then compare output at the real format, not the catalogue maximum. A practical factory trial should record good blisters per minute, reject rates, changeover time, and operator adjustments. Small details matter. A feeder pause can damage the headline number.
IQVIA’s Global Use of Medicines 2024 report forecasts global medicine spending could reach nearly 2.3 trillion dollars by 2028. This growth may increase demand for scalable, reliable packaging capacity. Yet higher volume does not always justify the fastest machine. A 200-blister-per-minute line may deliver better value if it maintains stable sealing and fewer interruptions. Smithers’ pharmaceutical packaging research also highlights continued demand for compliant, efficient, and adaptable packaging systems. Buyers should request audited output data, sample tooling, and documented acceptance tests. I would challenge every speed claim. A neat number can mislead.

For global buyers, PTP machine selection should begin with barrier targets, not machine speed. WVTR measures moisture transfer in g/m²/day, while OTR measures oxygen passage in cc/m²/day. ASTM F1249 commonly tests WVTR at 38°C and 90% relative humidity. ASTM D3985 commonly measures OTR at 23°C and 50% relative humidity. These conditions matter. A laminate may perform well in a dry laboratory, yet fail during a humid sea shipment.
Published pharmaceutical packaging studies often report cold-formed aluminum structures near or below 0.01 g/m²/day WVTR and 0.01 cc/m²/day OTR when pinholes are controlled. Polymer-based structures usually show higher transmission, especially after forming. USP General Chapter <671> also stresses package-specific moisture testing. Ask suppliers for complete test reports, including film thickness, temperature, humidity, test area, and conditioning time. Do not accept only a headline value.
The machine must match the selected barrier material. Check forming depth, sealing temperature, dwell time, pressure, and foil handling. A thin lidding foil can wrinkle under excessive pressure. A high-barrier laminate can crack around sharp forming corners. I have seen attractive laboratory data lose relevance after repeated machine trials. That weakness deserves attention. Request samples from three production lots, then test finished pockets after sealing and transport simulation. Imperfect data is still useful when its limits are clearly recorded. Cite: ASTM F1249, ASTM D3985, USP <671>, and Smithers, The Future of Flexible Packaging to 2028.
Select forming and lidding barrier materials using representative WVTR and OTR screening data. Lower values indicate better moisture and oxygen protection.
Representative nominal values for common pharmaceutical packaging materials. WVTR is shown in g/m²/day at 38°C and 90% RH; OTR is shown in cm³/m²/day at 23°C and 0% RH. Actual performance depends on thickness, coating, sealing quality, and test method. Typical methods include ASTM F1249 or ISO 15106-3 for WVTR and ASTM D3985 for OTR.
Choosing the best PTP machine for global buyers requires more than checking output speed. The machine must protect product quality and support reliable serialization. For the 2019 EU FMD framework, verify space for unique identifiers, batch details, expiry dates, and tamper-evident packaging. For the U.S. DSCSA, confirm that the system supports secure product tracing and accurate data exchange. Requirements can change, so ask for current compliance evidence.
2D DataMatrix readability deserves practical testing. Inspect codes on the actual blister foil, not only on a clean sample. Check contrast, cell shape, print position, quiet zones, and verifier grades. Test different speeds, foil finishes, lighting conditions, and worn printing components. A code may look clear to the eye but fail automated scanning. That happened in one of our production trials. The machine passed its demonstration, yet inconsistent foil tension reduced readability during longer runs. Small details matter.
Tips: Request a factory acceptance test with your materials. Use an independent verifier. Record scan results across several batches. Confirm reject accuracy and audit trails. Ask operators to repeat the test after cleaning and line changeover. Do not rely on one successful sample. Verify that the software preserves readable data through printing, inspection, aggregation, and export. A modestly slower machine may provide stronger control, fewer rejected packs, and more dependable global deployment.
Choosing the best PTP machine for global production requires more than comparing speed, tooling, or purchase price. OEE offers a clearer operational benchmark. The 85% world-class manufacturing standard combines availability, performance, and quality. It is a useful target, not an automatic promise.
A practical review starts with real production evidence. Ask for OEE data from similar blister formats, not only laboratory trials. Check planned and unplanned downtime separately. A ten-minute foil change may become forty minutes during a night shift. Measure output after warm-up, format changes, cleaning, and minor stops. Record rejected blisters, missing tablets, poor seals, and print defects. Small losses matter.
Look closely at the machine’s weakest hour. A line running at 92% during a short test may fall below 70% after repeated changeovers. Service response, spare-part access, operator training, and local electrical standards also affect availability. Experienced buyers should request FAT and SAT results, validation documents, and clear performance conditions. The 85% benchmark can expose hidden costs, but it can also mislead when product mix changes. Our first calculation may look impressive until quality losses are counted correctly. That deserves review. A strong decision compares total productive hours, not brochure speed, across several weeks of representative production.
| Evaluation Dimension | Recommended Benchmark | Typical PTP Machine Range | Why It Matters to Global Buyers | Verification Method |
|---|---|---|---|---|
| Overall Equipment Effectiveness (OEE) | ≥ 85% world-class reference | Target ≥ 85% after stabilization | Combines availability, performance, and quality into one productivity indicator. | Use the formula: Availability × Performance × Quality; measure during normal production. |
| Availability | ≥ 90% | 88–95% | Shows how much planned production time is lost to breakdowns, setup, adjustment, and material changes. | Review downtime logs, changeover records, and preventive-maintenance history. |
| Performance | ≥ 95% | 90–100% of validated rated speed | Identifies speed losses, short stops, and whether the machine can sustain its rated output with the selected product. | Conduct a run test with the buyer’s approved tooling, material, and production recipe. |
| Quality Rate | ≥ 99.9% | 99.0–99.9% acceptable packs | Reduces rejected packs, rework, product waste, and compliance risk. | Inspect seal integrity, forming quality, coding, perforation, cut accuracy, and reject-system performance. |
| Illustrative OEE Calculation | 90% × 95% × 99.9% = 85.4% | Meets the 85% reference | A machine can exceed the OEE target only when all three components remain balanced. | Calculate OEE from time-stamped production data rather than rated speed alone. |
| Maximum Web Width | Match the largest required pack format with a safety margin | Commonly about 150–420 mm, depending on machine class | Determines format flexibility, material utilization, and future product expansion. | Confirm effective forming width, pitch, web guidance, and approved material specifications. |
| Validated Output Speed | Use demonstrated output, not only nameplate speed | Approximately 100–600 packs per minute, depending on format and material | Actual output varies with cavity count, product geometry, sealing conditions, and inspection requirements. | Require a factory acceptance test using representative products and packaging materials. |
| Format Changeover Time | Preferably ≤ 30 minutes for repeat formats | About 20–60 minutes, depending on tooling and automation | Shorter changeovers improve availability and support multi-product production schedules. | Time the complete changeover, including cleaning, tooling exchange, adjustment, and first accepted pack. |
| Pack Material Compatibility | Support the buyer’s approved material specifications | Typical structures include PVC-based lidding combinations and aluminium-based barrier structures | Material compatibility affects sealing quality, barrier performance, waste, and regulatory acceptance. | Check material certificates, sealing-window tests, forming trials, and technical documentation. |
| Product Change Flexibility | Tooling and recipes should cover current and planned SKUs | Small, medium, and large formats require different forming and sealing configurations | A flexible platform lowers the risk of early replacement when product portfolios expand. | Evaluate format range, recipe management, tool-storage requirements, and change-part availability. |
| Inspection and Reject Control | Automatic detection and traceable rejection of critical defects | Common checks include missing product, seal defects, print quality, and registration errors | Protects product quality and supports controlled pharmaceutical packaging processes. | Challenge the system with known defects and verify reject confirmation, access control, and audit trails. |
| Data and Connectivity | Accessible OEE, alarm, batch, and maintenance data | PLC/HMI data logging with optional manufacturing-system integration | Reliable data supports root-cause analysis, remote assistance, and cross-site comparison. | Review data tags, export formats, user permissions, time synchronization, and cybersecurity controls. |
| Utilities and Operating Conditions | Meet the buyer’s local electrical, compressed-air, HVAC, and cleanroom requirements | Electrical supply and air demand vary by machine configuration and local standards | Mismatch in utilities can reduce performance, delay installation, or increase operating cost. | Confirm utility consumption, connection standards, environmental limits, and site-acceptance requirements. |
| Compliance and Documentation | Complete technical, validation, safety, and operating documentation | Documentation scope depends on the destination market and regulated-use requirements | Clear documentation simplifies qualification, operator training, maintenance, and inspections. | Check risk assessments, manuals, drawings, software backups, calibration records, and validation deliverables. |
| Total Cost of Ownership | Evaluate purchase price plus tooling, labor, energy, waste, service, and downtime | A lower purchase price does not necessarily provide the lowest lifecycle cost | OEE losses and difficult maintenance can outweigh initial equipment savings. | Compare five- to ten-year operating scenarios using verified consumption, spare-part, and service assumptions. |
Note: The 85% OEE figure is a widely used world-class manufacturing reference. Actual PTP machine performance depends on product format, packaging materials, tooling, operating conditions, changeover frequency, and quality requirements; all ranges should be confirmed through a product-specific acceptance test.
Global buyers should judge PTP machines through evidence, not polished brochures. A capable supplier explains forming, feeding, sealing, coding, and rejection controls in measurable terms. During FAT, request production trials using your actual tablet sizes and packaging materials. Check seal integrity, pocket dimensions, print accuracy, changeover time, and reject rates. Keep samples from each trial. They support technical decisions later.
FAT should resemble your factory conditions as closely as possible. Test alarms, guarding, emergency stops, data records, and operator access. Ask for raw results, not selected photographs. Small gaps matter. A machine may pass a demonstration yet struggle with dust, temperature changes, or frequent format changes. Document every deviation, assign an owner, and set a closure date before shipment. This discipline improves safety and reduces expensive surprises.
SAT confirms whether the machine performs after installation, utility connection, and staff training. Repeat critical tests at normal speed, then inspect output after several hours. Measure availability, material waste, labor needs, maintenance time, spare parts, validation effort, and energy consumption. These figures build a realistic Total Cost of Ownership model. Purchase price alone can mislead. Include freight, installation, qualification, software updates, downtime, and disposal costs. Be honest about uncertainty. Forecasts are rarely perfect. Use conservative assumptions and review them after three and twelve months. A reliable decision connects FAT evidence, SAT results, and lifecycle costs to the actual production plan.